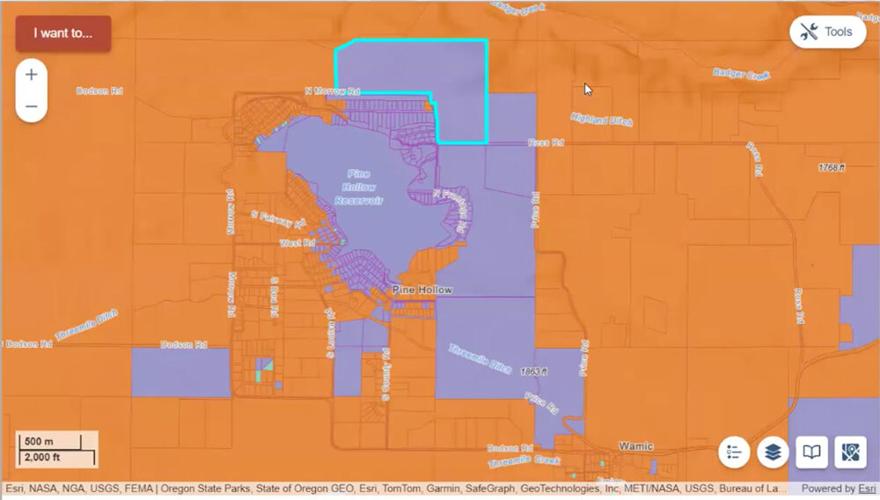
“The patchwork is a little weird, and there should be either justification for it or adjustments,” Commissioner Hege said. Commission Chair Steve Kramer emphasized that the map is still in draft form and needs, “a lot of work.”
Image courtesy Wasco County Board of Commissioners Meeting Aug. 7
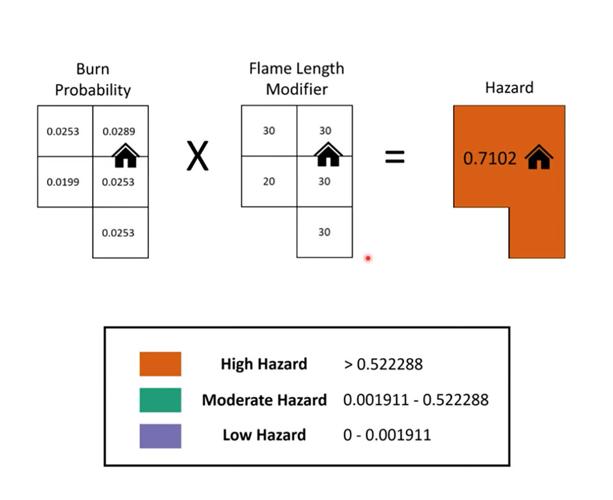
ODF Spokesperson Derek Gasperini explained that in order to eliminate bias, researchers divided the entire state—both public and private land-–into 100 by 100 square foot ‘pixels’ and determined the hazard calculation within that pixel. Each tax lot’s hazard designation is an average of the pixels within its boundary.
THE DALLES — Is irrigated farmland reliably less hazardous in the event of a wildfire? Researchers behind the Oregon’s wildfire hazard map say yes, and the latest draft of the map already includes a reduced level of wildfire hazard on 2.7 million acres of land across the state irrigated at least one year out of the past five.
With the threat of wildfire escalating across the state in recent years, Senate Bill 762’s wildfire hazard map aims to help government agencies prioritize wildfire spending and fuels-mitigation efforts. New building codes, which are still being developed by the Oregon Building Codes Division, will only apply to new construction and major renovations on properties with a high risk of fire exposure in the wildland urban interface (WUI).
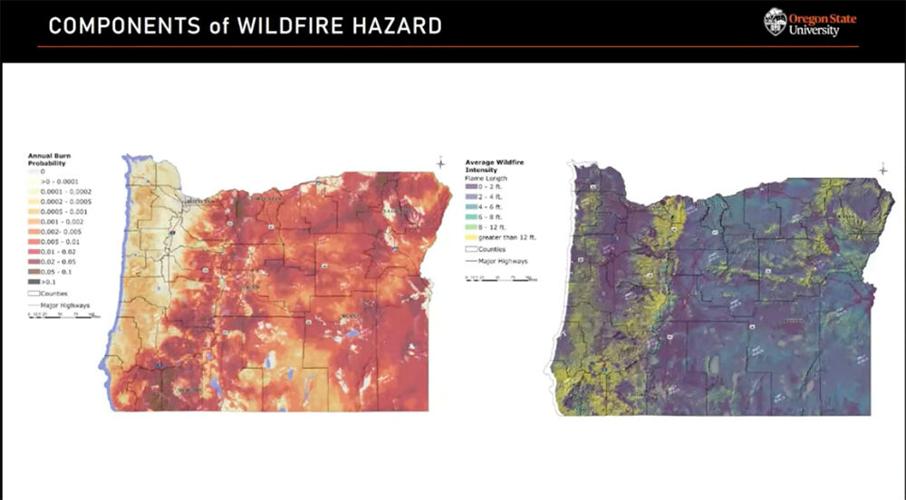
The lot-by-lot map created by Oregon State University (OSU) and the Oregon Department of Forestry (ODF) indicates the property’s level of exposure to fire based on a combination of two main sets of data: Burn probability and fire intensity, which depends on four characteristics: Climate, weather, topography and vegetation. Researchers combined this data with information from previous wildfires along with simulations of more than 10,000 fire seasons.
The first map released in 2022 sparked controversy and even outrage from residents across Oregon, many of whom saw the map as a gateway to burdensome regulations and/or were worried the map had a role in recent home insurance increases or cancellations due to wildfire.
Oregon’s Division of Financial Regulation states the map cannot and has not been used for insurance purposes; insurers use their own maps. Still, the state officials pulled the initial map just months after its publication and directed researchers to spend the last two years working on a second draft, released this July.
The latest version contains three levels of fire hazard (low, medium and high) compared to the previous draft's five, along with the following changes:
Adjustments for hay and pasture lands.
Adjustments for northwest Oregon forest fuels.
Changes based on the inclusion of irrigation of agricultural crops as a mitigating factor in wildfire hazard assessments.
In a narrow 4-3 vote on Sept. 4, the State Forestry Board officially adopted the rule specifying how many years a parcel must be irrigated to reduce its hazard level. OSU is still working with counties on a lot-by-lot basis to identify anomalies and adjust accordingly.
Yet as these changes and tweaks move toward finalization in October, some farmers particularly those growing on land designated a high wildfire hazard have questions.
“What we have out there is a checkerboard,” said Dan Van Vactor at a Wasco County board meeting Aug. 7. He and Steve Griffith, who are both active in local improvement districts, brought a recommendation from the Wasco County Forest Collaborative at both board meetings in August, asking the commissioners to advocate for a uniform hazard designation for irrigated cropland across the map.
At the Aug. 7 meeting, Van Vactor and Griffith panned through the hazard map explorer, zooming in on similarly-irrigated farmlands on the Wamic plain, some designated as high wildfire hazard and others as moderate.
For example, one lone 40-acre property is designated as low hazard amid medium-hazard neighbors, which looks strange from a Google map where the property looks fairly similar to the surrounding irrigated tracts.
Researchers call the checkerboard effect, where a property is designated differently from its neighbors, "speckling."
“Even irrigated fields are not fire resistant all times,” Commissioner Scott Hege said. “There’s times the irrigation grows a tremendous amount of material that then dries out at some point in time before it’s harvested.”
To Van Vactor and Griffith, however, the variation in hazard designations “seems wrong.”
The commissioners noted the map’s goal is to protect residents and help direct resources, but they agreed that some of the parcel designations and the speckling seemed strange.
“The patchwork is a little weird, and there should be either justification for it or adjustments,” Commissioner Hege said. Commission Chair Steve Kramer emphasized that the map is still in draft form and needs, “a lot of work.”
Image courtesy Wasco County Board of Commissioners Meeting Aug. 7
“The patchwork is a little weird, and there should be either justification for it or adjustments,” Hege said. Commission Chair Steve Kramer emphasized that the map is still in draft form and needs “a lot of work.”
Commissioner Phil Brady called the high-hazard designation an “insult” to Van Vactor and Griffiths, who have spent time and money creating defensible space and reducing fire fuels on their properties.
All three commissioners attended, either virtually or in person, a meeting hosted by the Association of Oregon Counties (AOC) on Aug. 26, which gave opportunity to officials from all counties to bring parcels of concern and make comments to representatives of OSU and ODF.
At a table surrounded by other county commissioners, researchers and state forestry officials, Hege lifted his iPad, showing the Oregon Wildfire Risk Explorer tool zoomed in on the lone low-risk parcel in Wamic. He said generally, he felt the map’s creators had done a good job, but the speckling and anomalous parcels may erode residents’ confidence.
“How can we trust this?” he asked. “You’ve been looking at it for 10 years, and on and on and on, and then what we end up with these lots that, honestly, I would bet you a lot of money are wrong.”
Brady asked, “Are we correct in assuming that being high hazard is bad?”
Many commissioners across the state had similar questions, wondering if a high designation is a burden on residents. They asked about speckling, and why side-by-side properties have varied designations, questioning how irrigated land factors into the creation of the new wildfire map.
Columbia Gorge News spoke to OSU and ODF to find out more about the new map’s creation, how irrigated farmland is considered and why the map has speckling.
New map weighs irrigation like a fixed characteristic of land
Andy McEvoy is a wildfire risk scientist at OSU, working on the wildfire map since the project’s start in 2021. He said irrigated farmland was a major topic amid concerns over the 2022 map. Many farmers with land designated the most hazardous wondered how their parcels could be considered a high wildfire hazard while they were surrounded by green, irrigated crops.
“It’s one of the things we heard about the most in public comment and appeals,” said McEvoy.
The nuance with considering irrigation’s impact on wildfire for the new map, McEvoy explained, is determining whether irrigation functions as a fixed characteristic of the vegetation (which the map considers), or whether it’s a risk-mitigating action like forest thinning or home hardening (which the map does not consider).
One of the biggest misunderstandings around the map has been the expectation that risk-mitigating action would result in reducing the parcel’s hazard designation.
Illustrating with the example of an earthquake, McEvoy described at the AOC meeting how bolting the home to a foundation would help protect it in the event of an earthquake, but it won’t prevent an earthquake from occurring in a seismic zone.
“Those are actions that property owners or land managers might take to mitigate risk, but they don’t constitute the environmental hazard itself, and they don’t mitigate the environmental hazard,” he told Columbia Gorge News.
Very little peer-reviewed research exists on the impacts of irrigated land on fire behavior, but OSU reviewed fire perimeter spatial maps going back to 1992 and observed fire perimeters stopping at the margins of large-acreage irrigated land.
This past spring, ODF created a Rulemaking Advisory Committee (RAC) consisting of leadership across the state, from the state Water Resource Department, to fire marshals, county officials, the Farm Bureau, scientists and researchers to evaluate this data and make policy recommendations to the State Forestry Board.
“By looking at the data the RAC determined that irrigation does represent a persistent characteristic of the vegetation when we can demonstrate that irrigation is applied persistently,” McEvoy said.
How relevant irrigated land was identified on the map
Any farmer will agree that irrigation is widely variable based on the crop, the water rights of the property and the time of year, so obtaining a reliable source of data to accurately measure irrigation in the format of a map presented a unique challenge.
Information from irrigation districts might show who is irrigating and how much water, but it won’t show exactly where the water is going on a map.
“The data that identifies irrigated areas has to be spatially explicit, so it’s a really high bar,” McEvoy said.
The OSU researchers ultimately chose Irrmapper, a data set from the University of Montana with 134 different inputs to identify land receiving agricultural irrigation going back as far as 1982.
“It’s the same data set that’s used for lots of related programs, including by the Oregon Water Resources Department, so it’s been vetted. It’s trusted,” he said.
Irrmapper distinguishes between agricultural land and other water-heavy land like wetlands or golf courses. Researchers combined this information with the Oregon Water Resource Department Field Boundaries data to pinpoint precisely where irrigation has taken place.
Some commissioners commented in the AOC meeting that they believe one year of irrigation out of five seems like too little water to reduce fire exposure.
“A lot of really nasty fuel can grow on a property in the other four years after that one year of irrigation,” said Commissioner Phil Chang of Deschutes County.
McEvoy said RAC’s recommendation was a compromise allowing the irrigation reduction to apply more inclusively across properties with constraints like water rights or crop type.
“Folks were concerned more about implications of the rule, rather than focusing on the science behind the rule,” he said. “That’s why, ultimately, they decided to take the most inclusive position possible.”
Irrigated land’s impact is measured on the pixel level, not the property level
While the map is currently divided into tax lots that can be searched on the Oregon Wildfire Map Explorer tool online, it wasn’t created that way.
ODF Spokesperson Derek Gasperini explained that in order to eliminate bias, researchers divided the entire state — both public and private land — into 100 by 100 square foot ‘pixels’ and determined the hazard calculation within that pixel. Each tax lot’s hazard designation is an average of the pixels within its boundary.
ODF Spokesperson Derek Gasperini explained that in order to eliminate bias, researchers divided the entire state—both public and private land-–into 100 by 100 square foot ‘pixels’ and determined the hazard calculation within that pixel. Each tax lot’s hazard designation is an average of the pixels within its boundary.
Photo courtesy Oregon State University
Gasperini gave an example. “If there is a corner of a lot that has topography subject to east winds and is closer to a large stand of timber, then that would increase the hazard for that portion, which would then average out over the property tax lot.”
Researchers adjusted for irrigation by applying the lowest possible flame length and burn probability to the hazard calculation, resulting in a low hazard designation for that particular pixel.
“We make adjustments at a pixel level,” McEvoy explained in depth at the final RAC meeting on Apr. 18, “that doesn’t mean any tax lot that includes irrigated agriculture will necessarily also be a low hazard. That’s going to depend on the composition of the tax lot.”
Two neighboring lots might have a similar size and appearance on Google Maps, but they might have different pixel compositions, resulting in speckling.
“It’s not necessarily appropriate to believe that we can sit at any given property and compare it to its neighbor visually,” McEvoy said at the AOC meeting. “There’s not an expert in the world that can look at two adjoining properties and tell me the difference in the burn probability. We can’t do that.”
Often, speckling occurs when neighboring properties sit at the numeric dividing line between moderate and high, with visually imperceptible differences pushing one property over the line.
Both Gasperini and McEvoy said their agencies are committed to working with counties on a lot-by-lot basis to resolve any issues in the map’s data.
“In assessing the hazard on 1.8 million tax slots, it certainly has gone through and will continue to go through a lot of review and a lot of fine scale comparisons from one spot to another before it’s made final in October,” Gasperini said.
Is a high hazard designation bad?
In answer to Commissioner Brady’s question during the AOC meeting about how to consider a high hazard designation, Gasperini pointed back to the map’s purpose — to direct state resources and inform community wildfire protection plans. High-hazard properties within the WUI will be first in line for home hardening and defensible space grants.
McEvoy noted that many residents and leadership around the state view SB 762 and SB 80’s impending building code requirements as a “burden” or a “penalty.”
“There’s still a lot of concern [from citizens] over how this high hazard designation will affect insurance or property values,” he said.
While the map represents neutral environmental data, McEvoy acknowledged that the RAC’s broader inclusion of irrigated land indicates that committee members made a decision that favors lowering the number of high-hazard tax lots. McEvoy said that as a scientist, he would prefer to reduce the hazard calculation only on properties that have irrigated five out of the last five years.
“If you irrigate this year, but you don’t irrigate next year, and then next year, your hazard just bounces right back to whatever the surrounding hazard is,” he said. “There’s no carryover effects from one year to the next.”
As mandated by SB 762, the wildfire hazard map will be updated every five years.
McEvoy said he is in the process of reviewing the potentially anomalous parcels submitted by Commissioner Hege, including those identified by Van Vactor and Griffiths.
“We’ve been working with planners and the public and others all along the way and making adjustments to this draft data,” he said.
No changes are currently required to properties, regardless of their hazard designation. To learn more about the timeline for building code requirements for high hazard properties in the WUI, visit the Oregon Building Codes Division’s wildfire hazard mitigation page. To learn more about making yards safer during wildfire season, visit the Oregon State Fire Marshal’sdefensible space page.
While the official public comment period for the map closed on Aug. 18, Gasperini has invited Oregon residents to contact his office directly with questions and concerns at hazardmap@odf.oregon.gov.


Commented