Partly to mostly cloudy. High 61F. Winds light and variable..
Tonight
Rain showers early will evolve into a more steady rain overnight. Low around 45F. Winds WNW at 5 to 10 mph. Chance of rain 100%. Rainfall around a quarter of an inch.
Over half of Americans (57%) said rising chocolate prices are changing how much they dish out for candy this Halloween.
The new study by financial services company Empower, which polled 2,000 general population Americans, found a third consider Halloween one of the costliest holidays of the year and the average American plans to spend $296 — including candy, costumes, decor and entertainment.
Younger generations plan to spend almost double that, with millennials averaging $522 and Gen Z averaging $435.
Yet, despite the price tag, 51% said Halloween is one of their favorite holidays, and nearly six in 10 (57%) said the memories they make with friends and family on Oct. 31 are priceless.
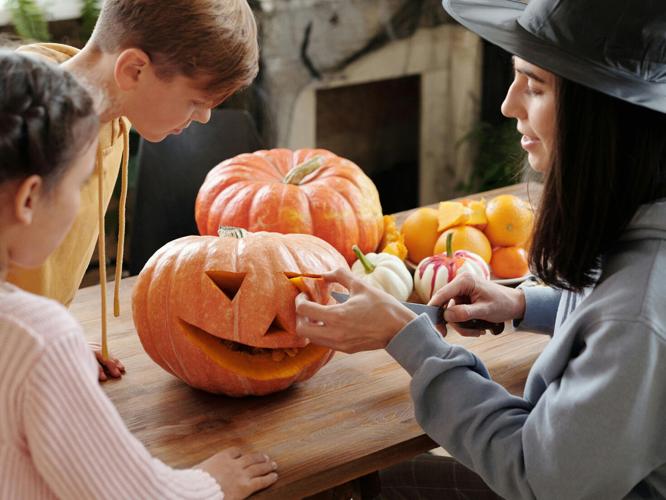
(Photo by Aleksandar Cvetanovic via Pexels)
By Talker
Still, five in 10 are cutting back on Halloween spending overall due to inflation (52%), though 39% of Americans say they overspend each year, highest among millennials (52%) and Gen Z (48%).
More than half of Americans surveyed (54%) believe parents today feel pressured to spend more on Halloween than past generations.
Almost a third (31%) say they end up spending more when they see friends or family doing so, even if it’s beyond their means (53% Gen Z, 50% millennials).
“Some consumers may be ghosting chocolate this Halloween as prices creep higher. Trick-or-treat spending offers a peek into how pricing pressures are shifting budgets and filtering into the smallest traditions,” said Rebecca Rickert, head of consumer insights at Empower.
Most shoppers will start looking for Halloween items in September (39%) and October (43%), despite the rise of retailers offering “Summerween.” Though, a quarter of millennials (26%) start shopping for Halloween no later than August.
Two in five (40%) respondents said they look forward to Halloween shopping more than shopping for other holidays (61% millennials, 56% Gen Z).
To save money, close to a quarter said they often reuse or recycle costumes from past years (22%) or shop at thrift stores/discount retailers for Halloween looks (22%). One in five prefer to DIY or make costumes at home (20%).
Close to a quarter (23%) of Gen Z and millennials buy costumes for their pets, even if it costs extra (18% overall).
(Photo by Artie Siegel via Pexels)
By Talker
A quarter of younger generations will use AI to find the best deals on candy, costumes or decorations (25% millennials, 24% Gen Z) — as well as to generate costume ideas (27% millennials; 24% Gen Z).
More than one in five millennials will also use it to help plan fall or Halloween-themed travel (21%).
Even with tighter budgets, Americans want Halloween to feel memorable: 45% said they’d rather spend on experiences like trips or parties than on décor.
These experiences include: pumpkin patches or harvest festivals (31% overall; 41% Gen Z, 39% millennials), Halloween parties (23% overall; 39% millennials, 35% Gen Z), and Halloween theme parks or haunted houses (21% overall; 37% millennials, 35% Gen Z).
While almost three in 10 Gen Z (28%) and millennial (27%) respondents will also be visiting a haunted or historic towns (like Salem or Sleepy Hollow) — only 17% of Gen X and 4% of baby boomers are incorporating that into their fall plans.
Empower’s “Halloween Spending” survey was commissioned through Talker Research and based on online survey responses from 2,000 general population Americans (aged 18+) from Sept. 10–16, 2025.
We are sourcing from a non-probability frame and the two main sources we use are:
Traditional online access panels — where respondents opt-in to take part in online market research for an incentive
Programmatic — where respondents are online and are given the option to take part in a survey to receive a virtual incentive usually related to the online activity they are engaging in
Those who did not fit the specified sample were terminated from the survey. As the survey is fielded, dynamic online sampling is used, adjusting targeting to achieve the quotas specified as part of the sampling plan.
Regardless of which sources a respondent came from, they were directed to an Online Survey, where the survey was conducted in English; a link to the questionnaire can be shared upon request. Respondents were awarded points for completing the survey. These points have a small cash-equivalent monetary value.
Cells are only reported on for analysis if they have a minimum of 80 respondents, and statistical significance is calculated at the 95% level. Data is not weighted, but quotas and other parameters are put in place to reach the desired sample.
Interviews are excluded from the final analysis if they failed quality-checking measures. This includes:
Speeders: Respondents who complete the survey in a time that is quicker than one-third of the median length of interview are disqualified as speeders
Open ends: All verbatim responses (full open-ended questions as well as other please specify options) are checked for inappropriate or irrelevant text
Bots: Captcha is enabled on surveys, which allows the research team to identify and disqualify bots
Duplicates: Survey software has “deduping” based on digital fingerprinting, which ensures nobody is allowed to take the survey more than once
It is worth noting that this survey was only available to individuals with internet access, and the results may not be generalizable to those without internet access.


Commented